This tool has a very friendly and easy-to-use user-interface (UI), which allows for a wide variety of transformation steps to be completed without manually writing a single line of code. However, as you begin to encounter more complex datasets, you’re likely to become familiar with the M (or Mashup) formula language that the tool is based upon. For every query that is created in Power Query, there is a corresponding M query that is run that can be viewed in the Advanced Editor.
Whether you've been using Power Query for a while and are now looking to level up your skills into the world of the Advanced Editor, or if you've already started to explore the M language but are trying to clean up your code, custom functions in M can be an extremely powerful tool to have at your disposal. This article will walk you through how to get started with creating your own custom functions, all without needing any in-depth knowledge of the M language. With just a few minor changes in the Advanced Editor, you can easily turn applied steps in a query into a function that can be called upon in any query for your model, collapsing complex transformations into a single step. As a supplement to this article, I encourage you to visit our YouTube channel to see the video we created to demonstrate this process.
Understanding the Limitations of Standard Pivot Tables
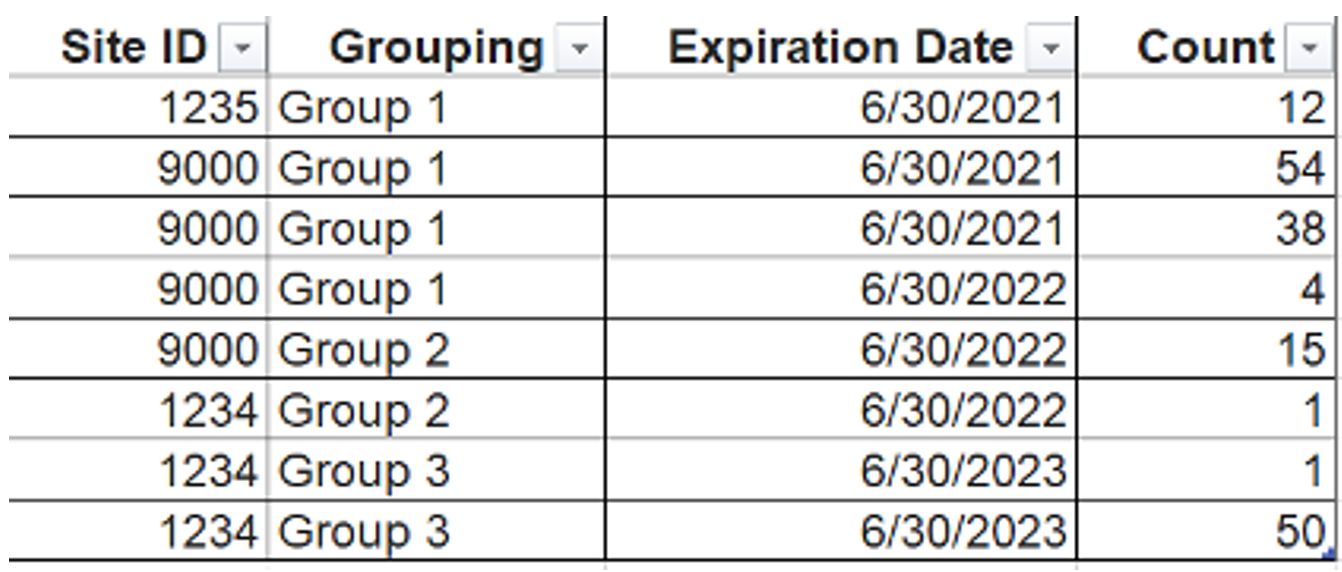
I’m going to use a simple example to illustrate how custom functions can be created without needing any in-depth knowledge of the M language. Let’s begin by pivoting a table from first principals. We will use the sample source data in the table below for this example.
Using a standard pivot table, we can achieve the result shown below:
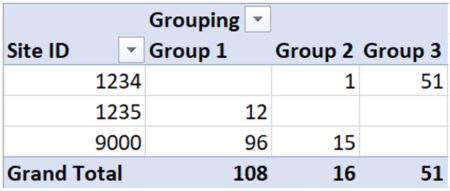
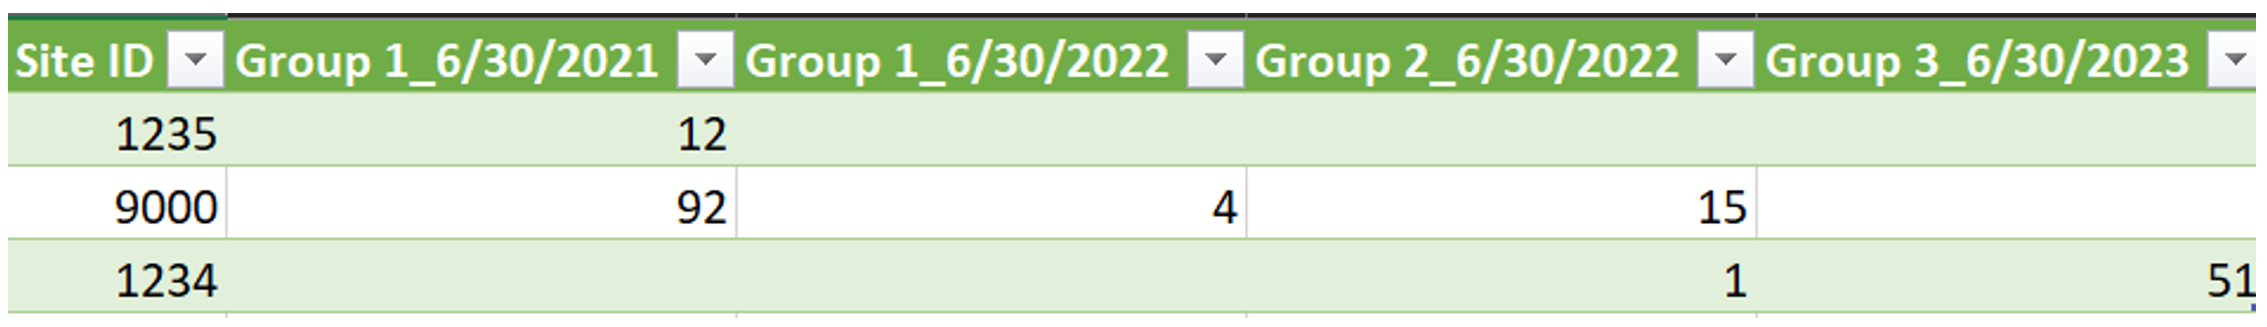
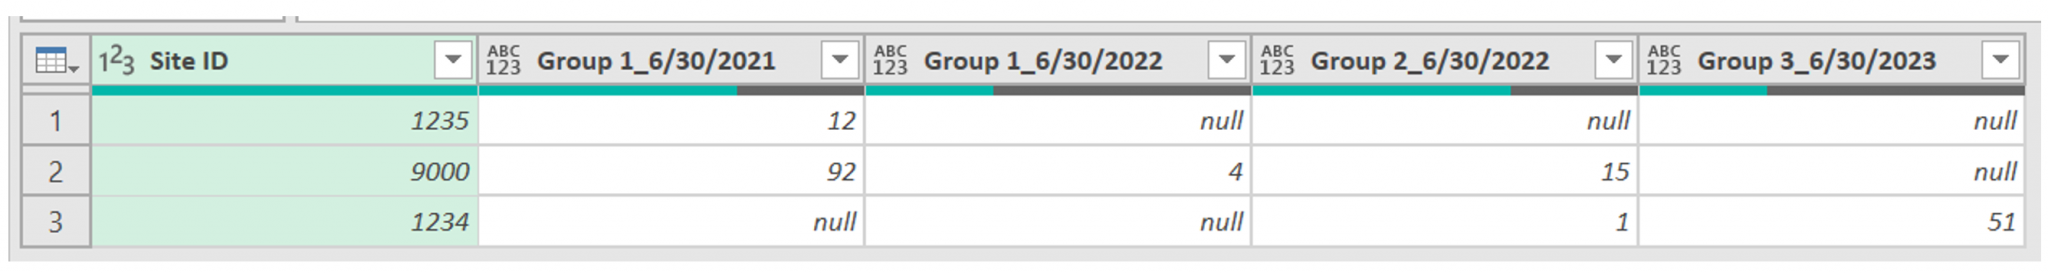
While this standard pivot table gives us the basic information we need, it does have its limitations. What if we wanted to include other dynamic content into this table? What about using the resultant table as an input for other data transformations? Power Query can help us complete these more advanced transformations in order to arrive at an enhanced pivot table (as depicted below), which is the end-result of the steps we will be taking in this article.
Creating a Custom Function with Minimal M Inside of Power Query
Step 1 (Setup): Group by Rows
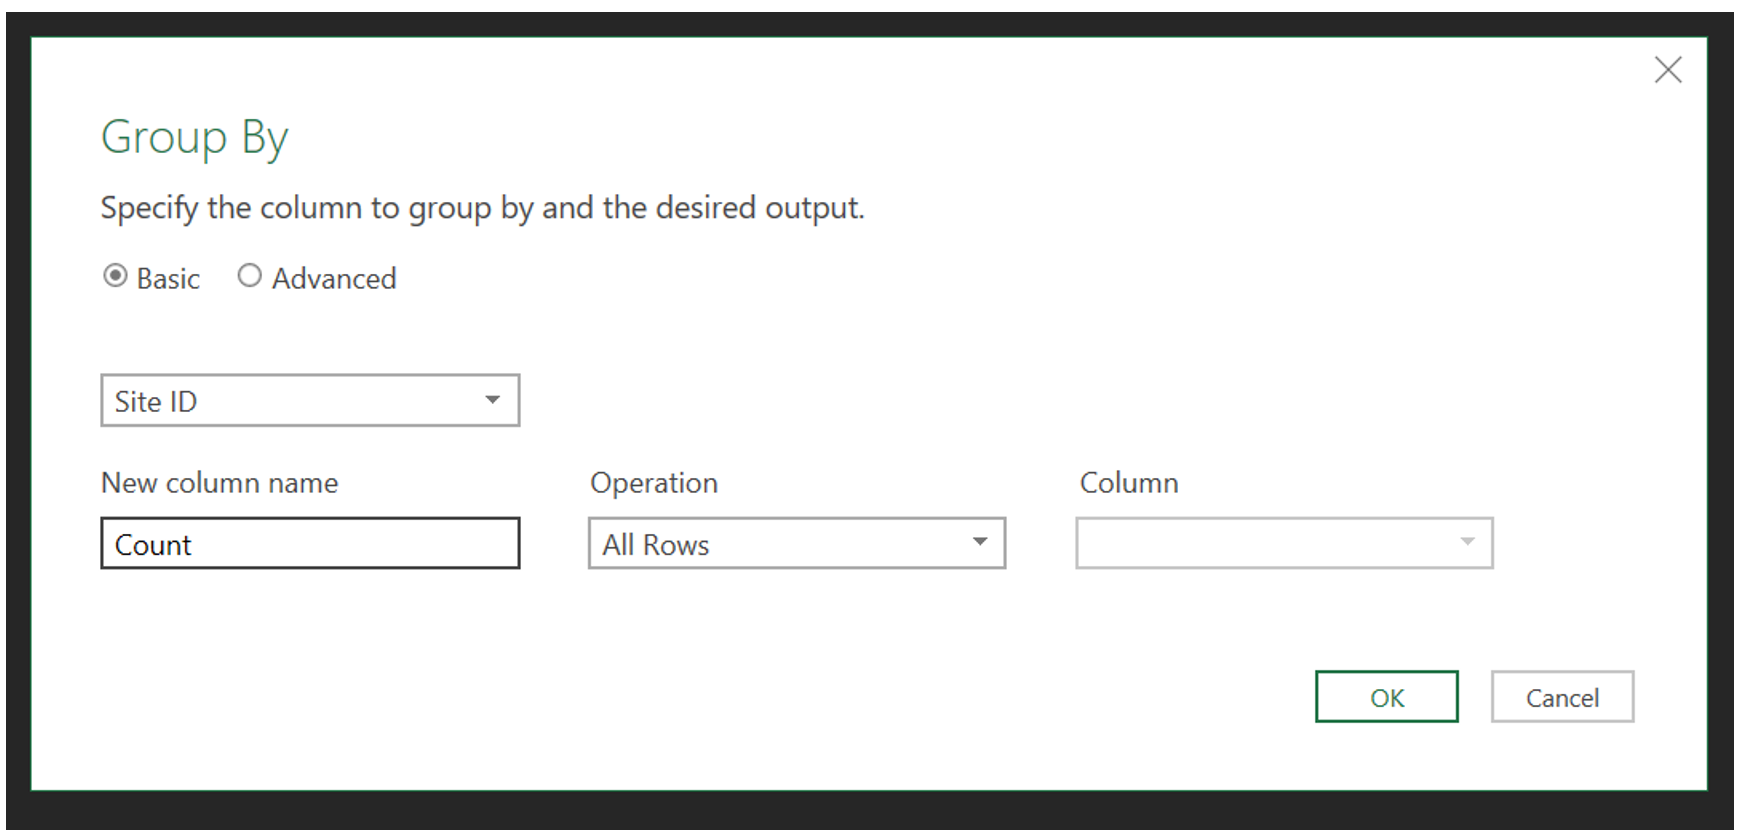
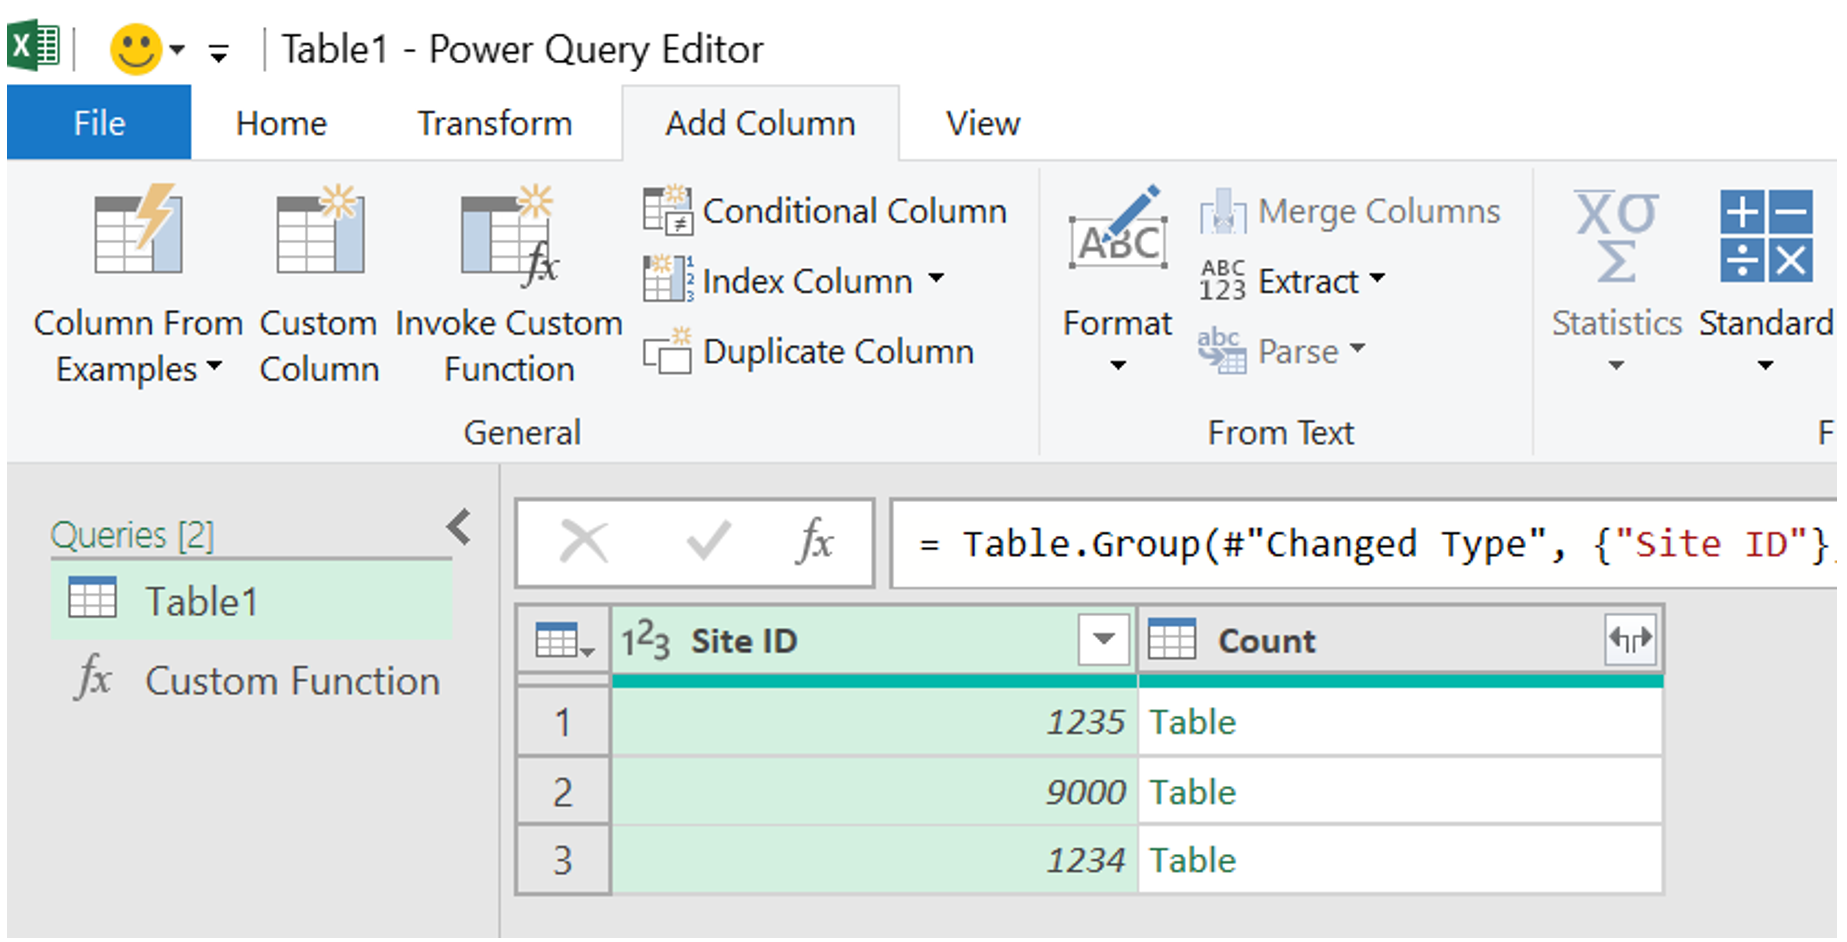
Let’s begin by simply grouping the rows of the original dataset together by their site ID. This will allow us to gather our data into buckets, which can then each be managed individually. This is done using the “Group By” feature in Power Query under the “Transform” tab of the ribbon. In grouping our data, we’ll also want to preserve all of the original context of the data, rather than summarizing any columns. To do this, select “All Rows” from the “Operation” drop-down menu, as depicted in the dialogue box below.
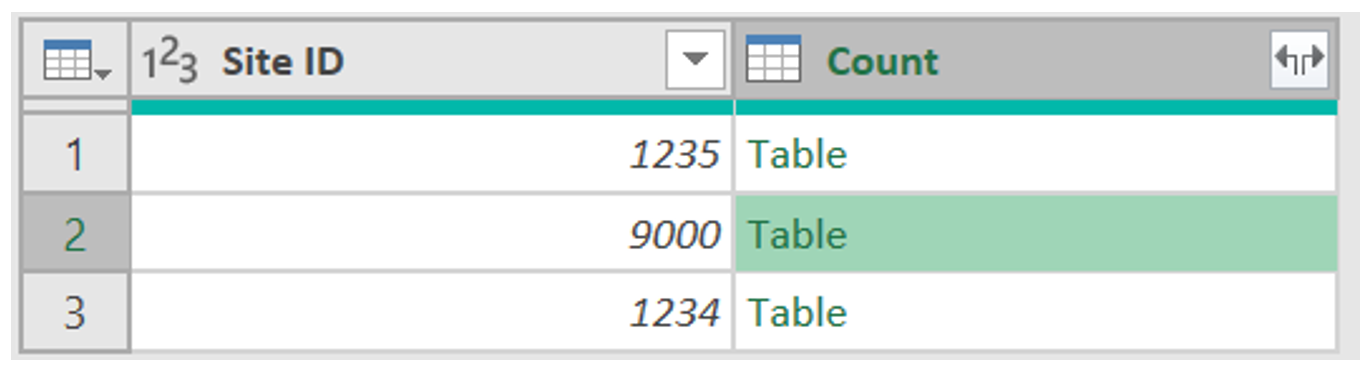
This will result in a table that contains a column of tables. The contents of this table are viewable in the preview pane by selecting the cell that the table resides in.
Step 2 (Setup): Drill Down into a Sample Table
Now that all our data is organized into individual tables per site, the next step is to drill down into our sample table. This can be done by clicking on any of the green word “Table” instances in our column, as depicted below. The tables shown in the “Count” column here will ultimately be the inputs to our custom function. By selecting one table to begin with, we are able to use the Power Query user interface to build out the steps of our function as a way to avoid writing any custom M by hand.
Step 3: Transform the Data for Formatting Purposes
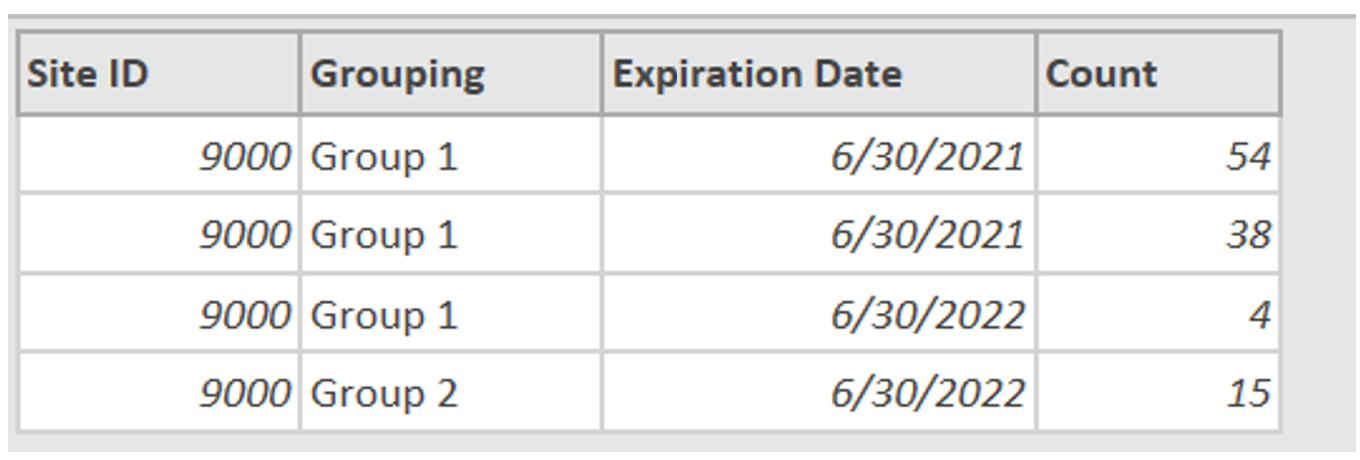
After we select (or drill down into) a sample table, we are going to apply a series of transformations to get the data into the format we desire. By looking at our desired result set, we can see that we will want to combine “Grouping” and “Expiration Date” into a single column as a grouping ID, and then add up all instances where the grouping ID exists to form a single row per grouping ID.
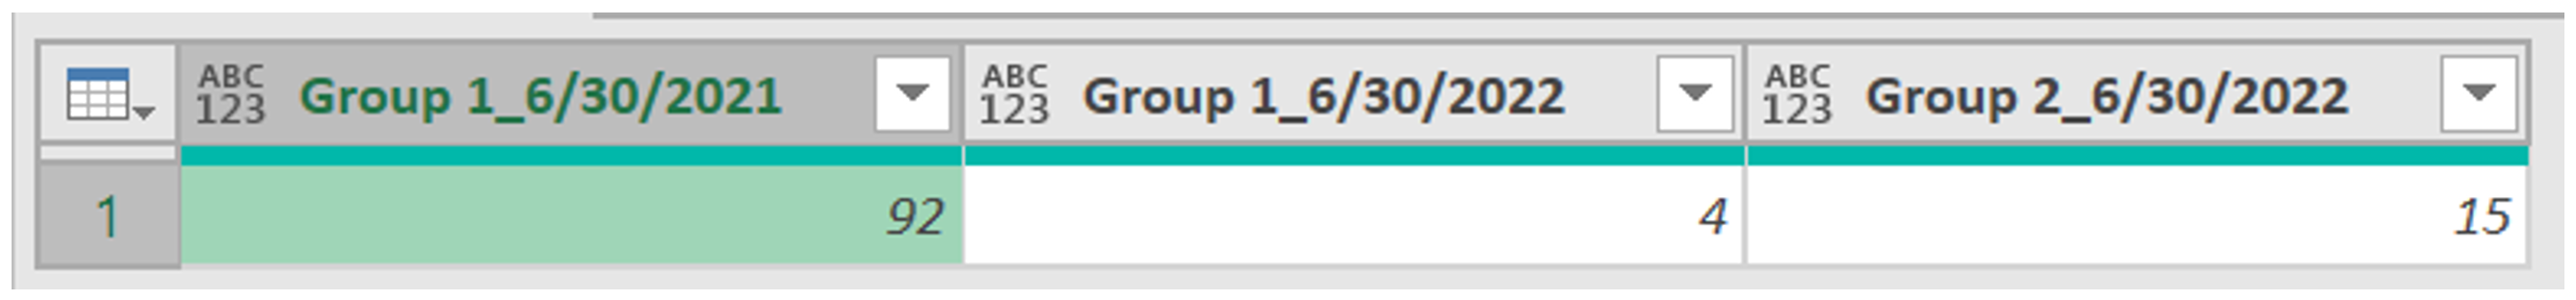
Once this is achieved, the table can be transposed to turn a series of rows instead into a series of columns.
These are steps that most users should already be familiar with on the user interface. The end result in the “Applied Steps” area on the right of the Power Query window should reflect the steps you took to achieve this desired table.
Step 4: Copy the Code into a Blank Query
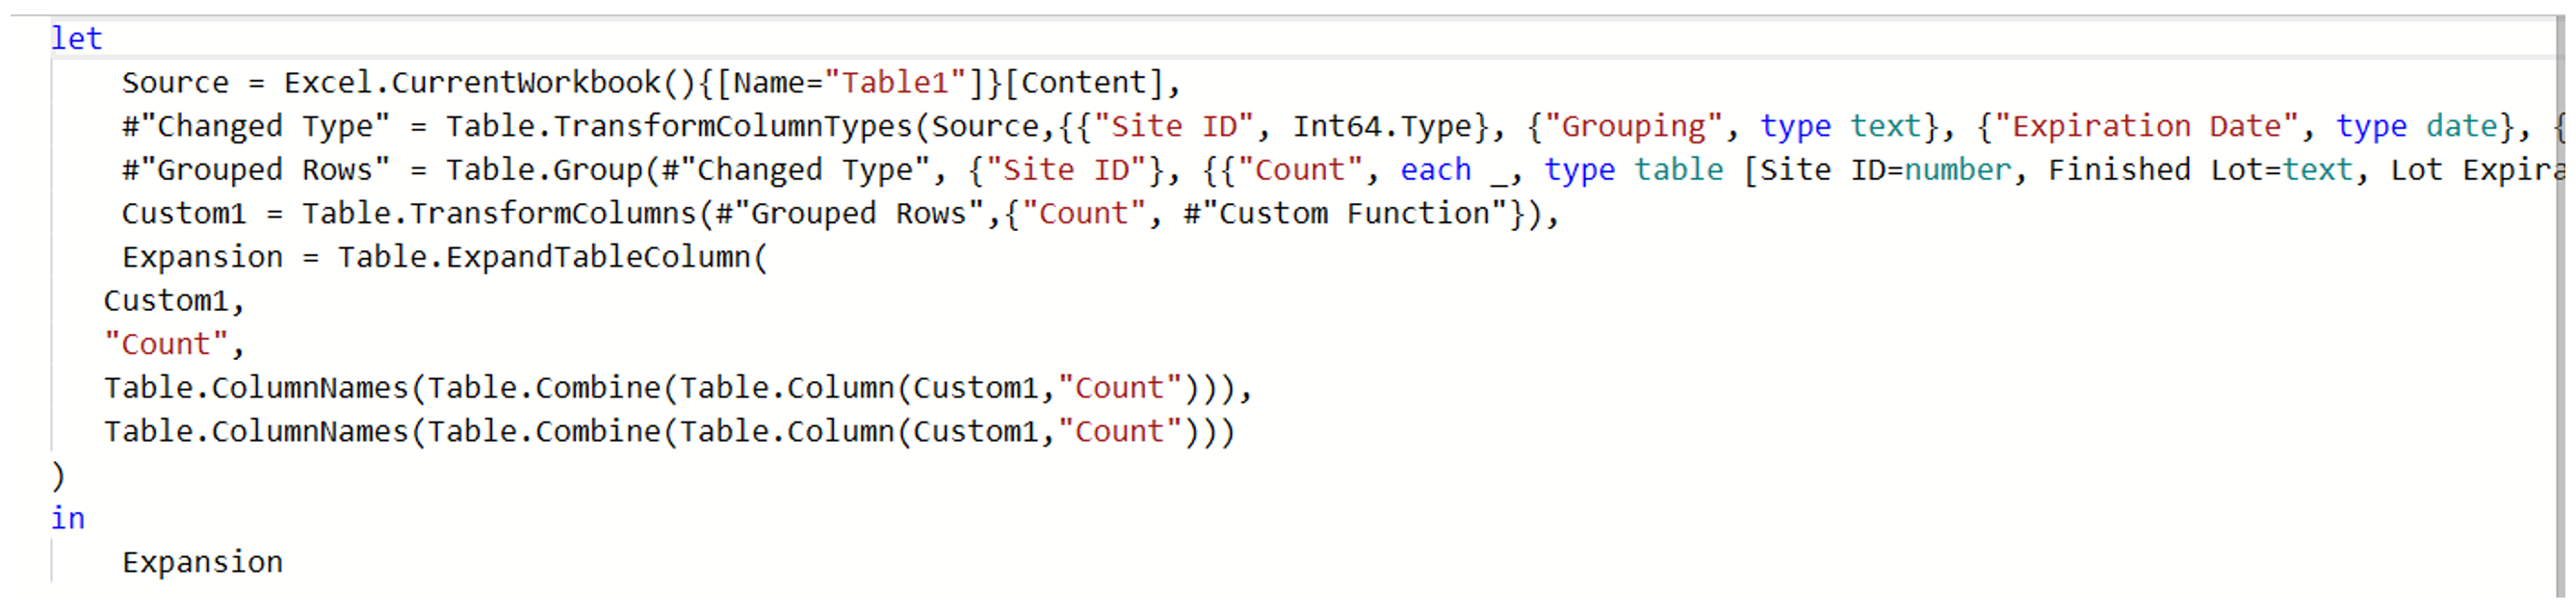
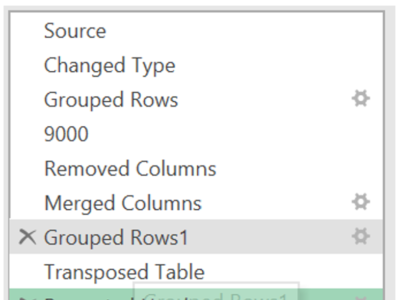
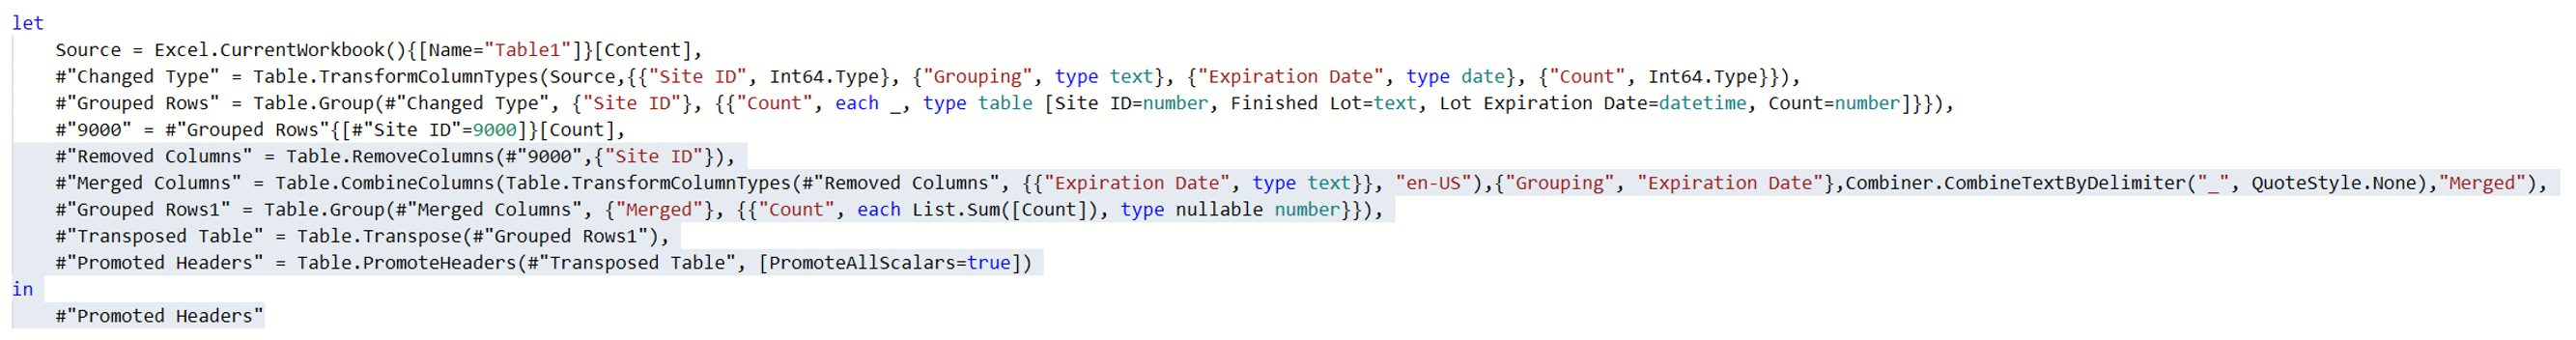
Now that we’ve created a sample table, let’s take this same logic and apply it to all the site-specific tables at once. To do this, navigate to the advanced editor and directly copy the code that was already generated by the user interface. This will allow us to create a custom function using that exact code. Since we want to capture all the steps after the point where we drilled into a single table, we can simply find that step by the same name as shown in the advanced editor and copy everything after that onto our clipboard.
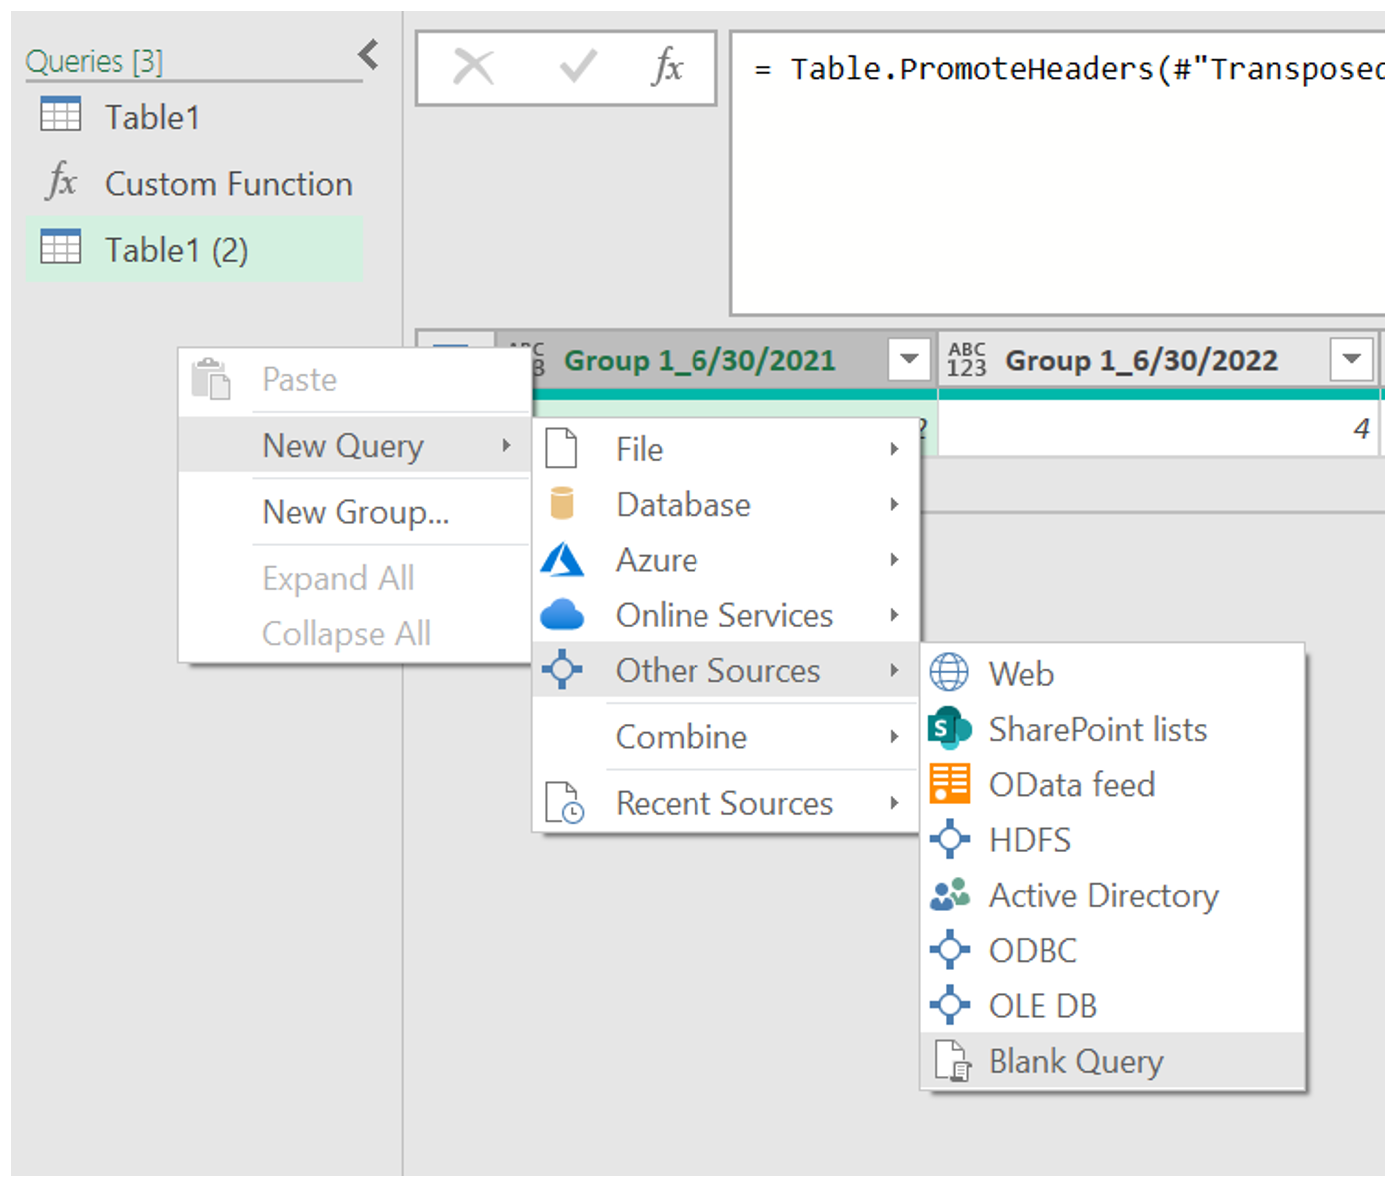
With that information copied, we will now form a new blank query that will act as the living space for our custom function and paste the code into the advanced editor. To create a blank query, right click the “Queries” pane, then select New Query --> Other Sources --> Blank Query. Then, paste your copied code.
Step 5: Adjust the Code to Create a Custom Function
After pasting the code into the new blank query, we’ll want to make a few small adjustments so that we can turn table transformation steps into a function that can be called upon. First, list out all function inputs. Next, change the step reference of our first transformation so that it pulls in those function inputs.
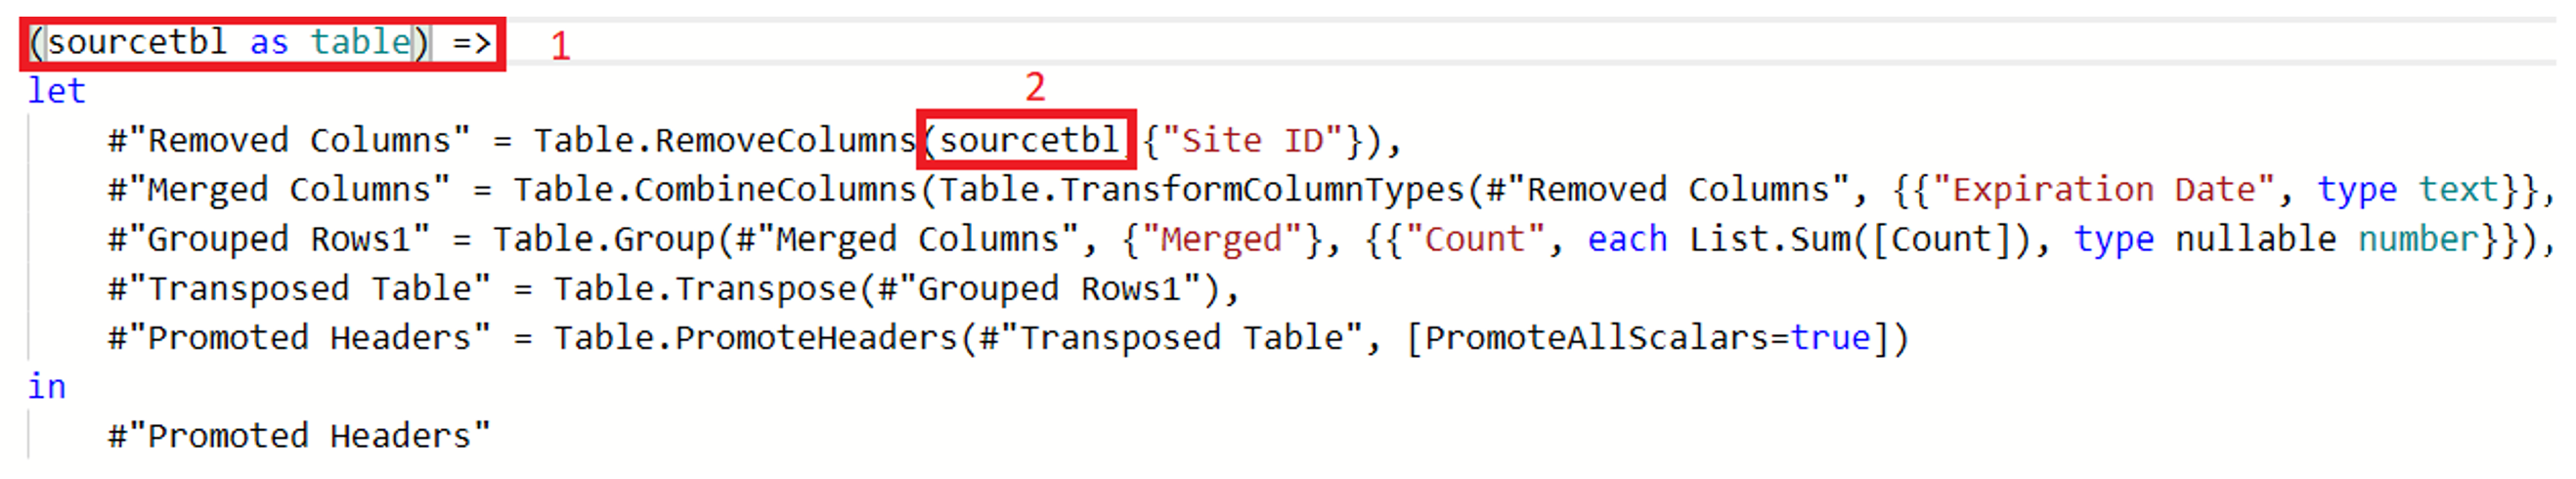
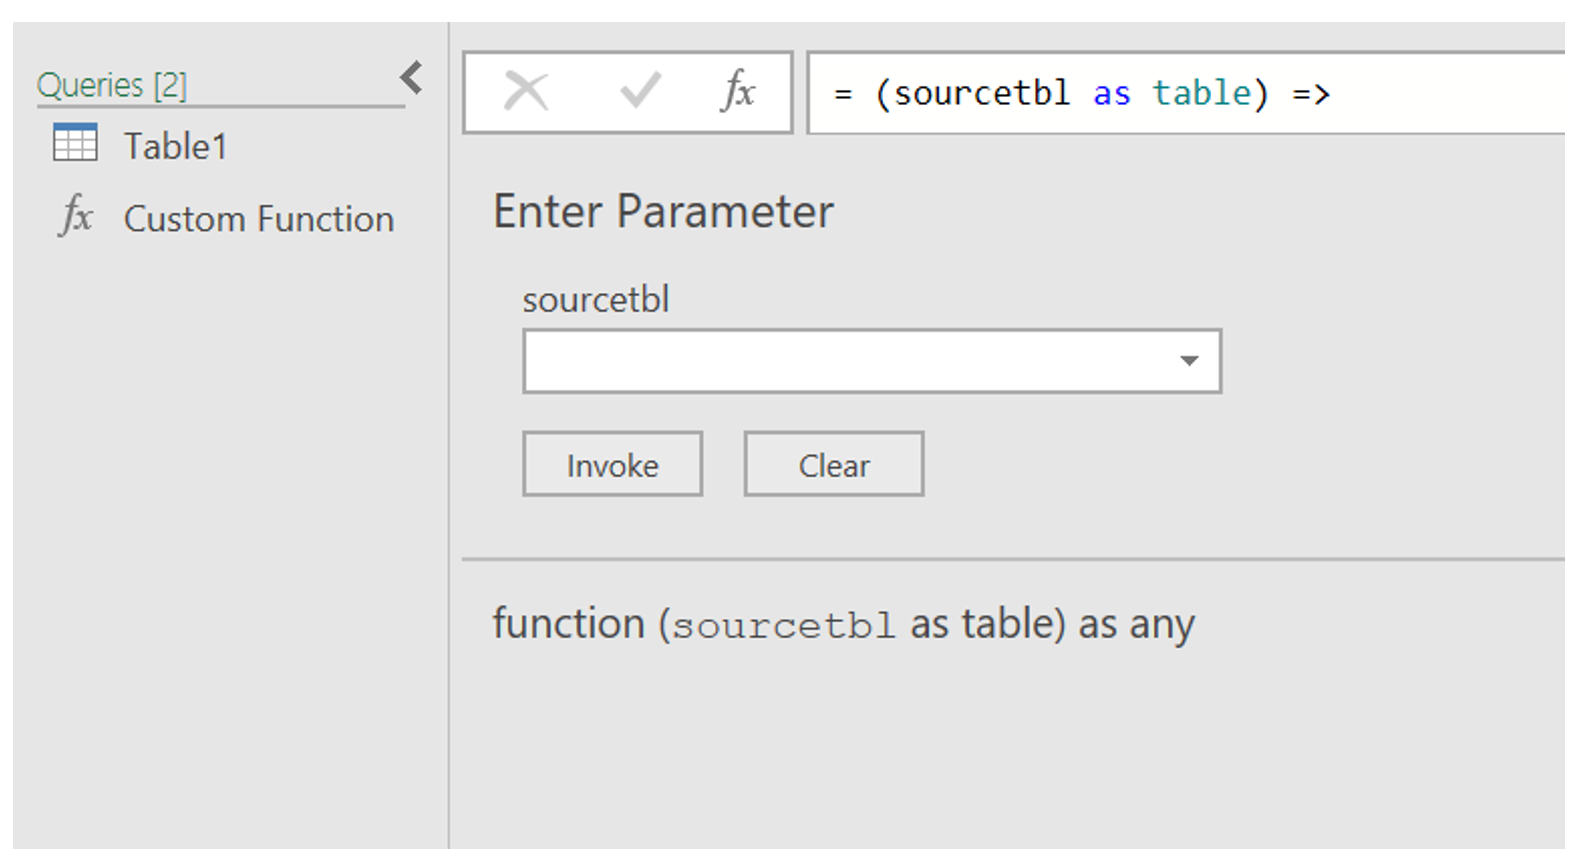
In the first red box above, you’ll notice a very small amount of manually typed M code within the start of the expression. The information in this red box is the key that tells Power Query that this is going to be a function. Inside of a single pair of curved brackets, we can specify both the name of our input (sourcetbl), as well as the type of the input (as table), followed by an arrow operator. The arrow ( => ) lets the Power Query engine know that all items prior to the arrow are inputs for a function and instructs the engine to then pass those inputs into the function below.
In the second red box, you’ll notice that the name of the original table that we chose to drill down into (#”9000” in this example) has been replaced with the name of our specified input, sourcetbl. This allows any table that is invoked as an input to this function to pass into the steps defined below. (Note: It’s not vital to know the intimate details of the M code generated by Power Query below this step, but it is a great learning tool!)
Upon exiting the Advanced Editor, you will see that the Power Query user interface has changed to adjust to the fact that the selected query is now a function. The icon in the query pane has changed to a function identifier, and the dataset preview has been substituted with a list of the function inputs.
Step 6: Invoke Custom Function
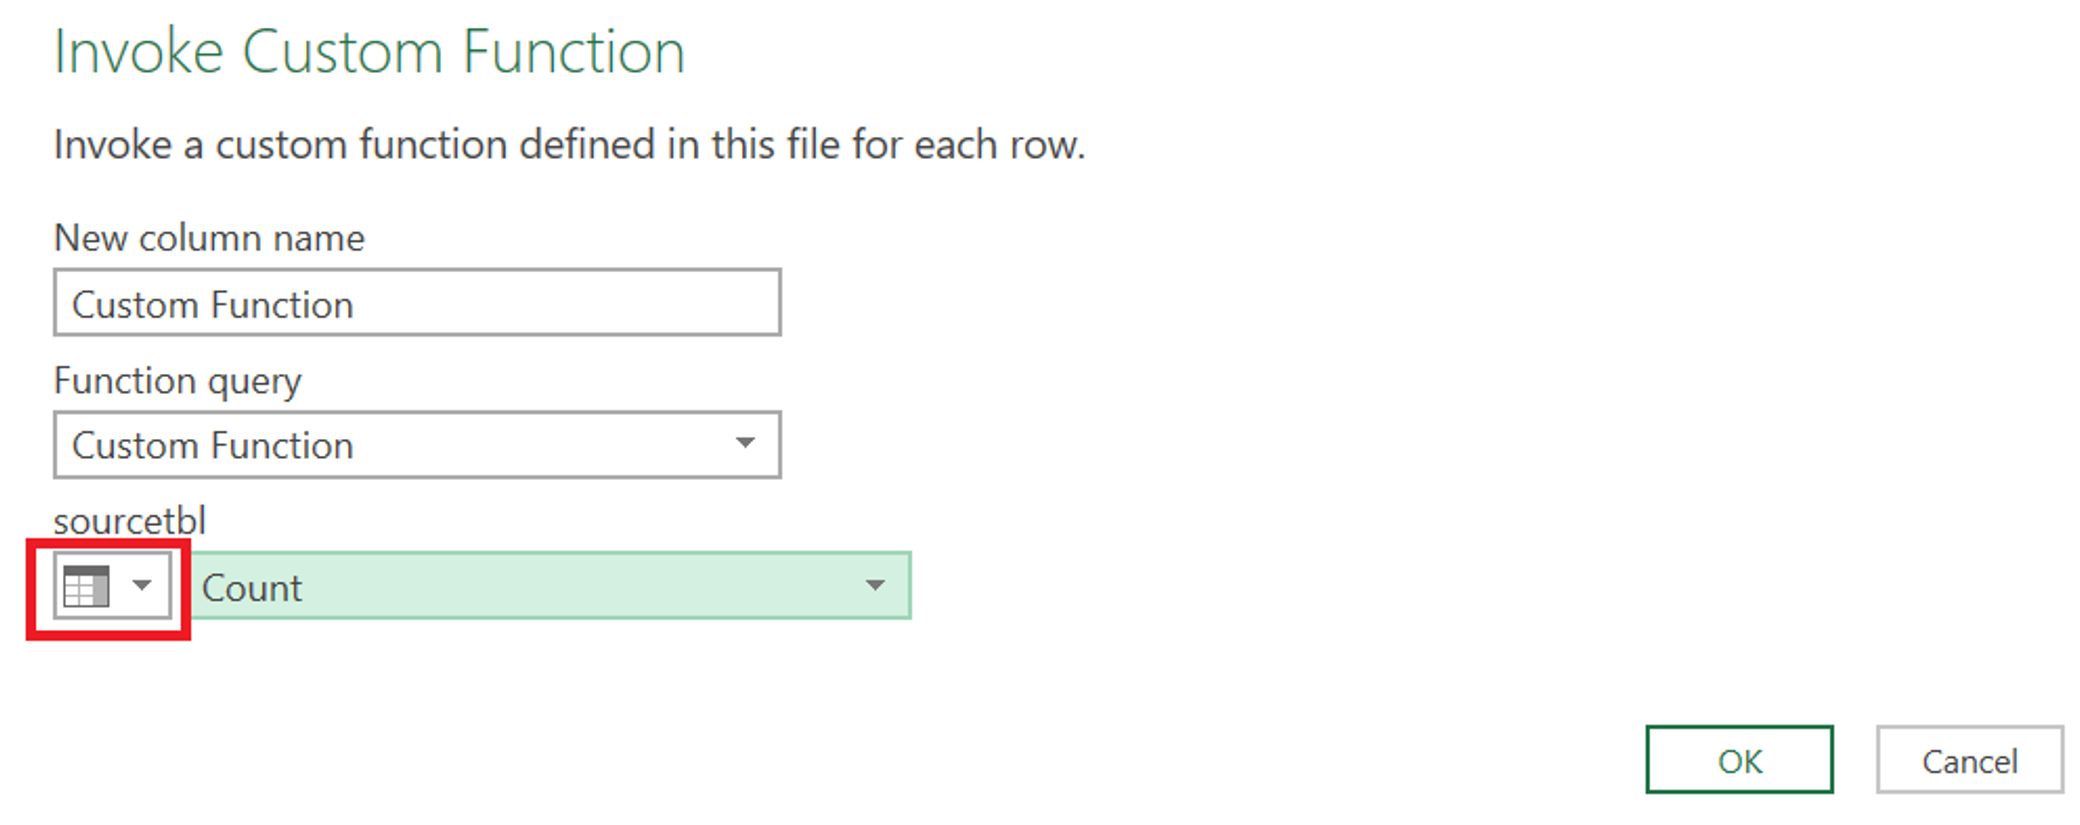
Now that our function has been created, we simply need to call upon it in our original query, which can be done either in a custom column, or by using the “Invoke Custom Function” option in the ribbon. Return the original query to the point at which we have a column of tables, as depicted in the image below. The “Count” column will be used as our input.
Upon selecting “Invoke Custom Function”, a dialog box will appear prompting for the function query to be selected, at which point the function input parameters will be listed out. By selecting the dropdown highlighted below, we can specify that we are inputting an entire column of tables into our query. This allows for all the applied steps that we created in our custom function to be applied in a single step, making for very clean, easily replicable code.
After invoking the function, it may look as though nothing has changed. However, we can see the results of the function in the preview pane. We can expand this column out to get our final result by clicking on the expand button in the top right of the screenshot below.
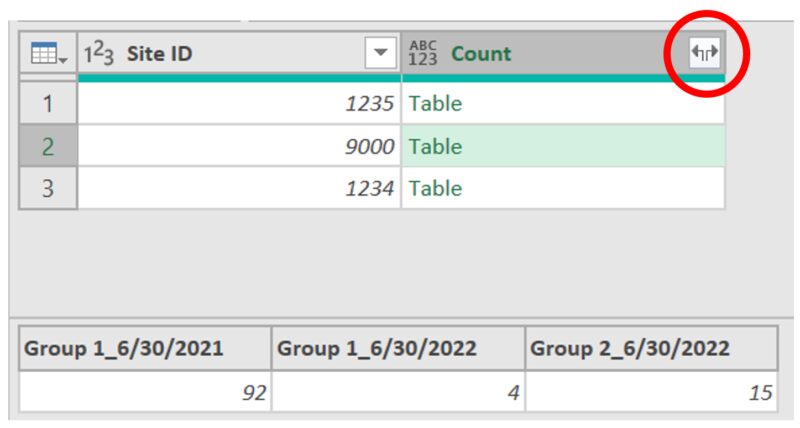
Upon expanding the columns, we will arrive at our desired end result table:
In Closing
You now have the tools you need to create a custom function inside of Microsoft Power Query with minimal knowledge of the M language. If you have any questions, please feel free to reach out me here. We are constantly adding more Power Platform content to our YouTube channel (among other innovative technology topics), so I encourage you to subscribe so you can be notified when new videos are posted! To learn more about Envision’s Data Analytics and Business Intelligence services, visit this page to explore our offerings or book a free consultation with our team of experts.